Passive multiple imputation
library(mice)
library(dmo)
Missing data in multi-item questionnaires
Multi-item questionnaires are instruments that measure a construct indirectly through items. Item scores can be continuous, dichotomous or measured on Likert scale. Usually, the summary score of items is the construct that is used in a substantive analysis.
Missing data in multi-item questionnaires can occur as item score missing data or as missing the full questionnaire. Both situations lead to the same problem: missing total score. Below you see three different missing data patterns for a questionnaire with 5 items.
##   item1 item2 item3 item4 item5 Total.score
## 1     1     0     0     0     1           2
## 2    NA     1     0    NA     1          NA
## 3    NA    NA    NA    NA    NA          NA
Multiple imputation in multi-item questionnaires
Missing values in multi-item questionnaire can either be handled by imputing item scores or by imputing total scores directly. On the one hand, item scores can hold valuable information. However, the total scores are often used in analyses, and an imputation model should be compatible with the analysis model.
The advised strategy for imputation is that when the majority of item scores are observed, to use item level imputation. But when only few item scores observed or none, to use total score imputation. And ideally, you would want to combine both strategies.
Challenges in multi-item questionnaire missings
There are two major challenges when dealing with missing item scores in multi-item questionnaires.
- The imputation model can grow large when all items are used, especially when more than one questionnaire is administered or when questionnaires are repeatedly measured in a longitudinal study.
- When the total score is used in analyses, the total score should be used as predictor in the imputation of other variables (i.e. imputation model should be compatible with the analysis model).
Solutions:
Imputation model can grow large when all items are used
- Isolate item imputation per questionnaire or subscale via
predictionMatrix
When the total score is used in analyses, the total score should be used as predictor for other variables
- Update total score after each iteration by using passive imputation.
- Use total score as predictor for other covariates via
predictorMatrix.
Illustrative example
Lets first generate some example data for this illustration. We can use a especially developed function from the dmo package to do this. The example data has data for two questionnaires, with each 5 items, and with 1 additional covariate.
#generate questionnaire data
k <- c(5,5)
x <- dmo::gen_qdata(n=20, k= k, likert = T)

#generate covariate data
set.seed(61085)
cov <- MASS::mvrnorm(n=20, mu=c(5,5,5), Sigma=matrix(c(10,1,1,1,10,1,1,1,10),3,3))
colnames(cov) <- c("cov1", "cov2", "cov3")

#combine in data.frame
x1 <- data.frame(cbind(x,cov))

alpha <- 0.25

#regerate 2 random patterns for missing item data
pattern <- matrix(c(sample(c(0,1), size=2*sum(k),replace = TRUE)),nrow=2)
pattern <- cbind(pattern, matrix(c(1,1,1,1,1,1),nrow=2, byrow = T))

#apply each pattern with equal frequency and equal odds
f <- c(0.5,0.5)
g <- c(4,4)

#generate missings in the data
set.seed(9817)
x <- dmo::MAR(x1,alpha = alpha ,pattern = pattern, f = f ,g = g)
colnames(x) <- gsub("_", "",colnames(x1))

#head(x, 15)
ts <- dmo::calculate_ts(x, k= c(5,5))
dat <- data.frame(x,ts) %>% select(Q1i1:Q2i5, TSQ1, TSQ2, cov1) %>% mutate(cov1 = round(cov1, 2))
dat
##    Q1i1 Q1i2 Q1i3 Q1i4 Q1i5 Q2i1 Q2i2 Q2i3 Q2i4 Q2i5 TSQ1 TSQ2  cov1
## 1    NA   NA   NA    1    5   NA    3    5   NA    1   NA   NA  7.23
## 2     1    5    5    1    2    5    5    1    5    5   14   21  1.61
## 3    NA   NA   NA    1    1   NA    5    3   NA    1   NA   NA  3.51
## 4     1    4    1    1    4    5    5    1    2    1   11   14  8.17
## 5     5    4    1    5    3    4    1    5    5    1   18   16  5.20
## 6     2   NA    1    1    5   NA    4    5    1   NA   NA   NA  4.42
## 7     4    1    4    1    1    1    1    2    1    1   11    6  4.03
## 8     3    1    4    5    2    1    4    1    1    2   15    9  0.09
## 9     5    4    5    5    2    1    1    2    1    1   21    6  3.22
## 10   NA   NA   NA    5    5   NA    1    1   NA    4   NA   NA  4.83
## 11    5    5    4    5    5    5    4    5    5    5   24   24 -0.24
## 12    5    1    3    5    1    5    2    4    1    5   15   17  3.50
## 13    1    5    5    5    4    1    3    5    1    5   20   15  3.61
## 14    2    5    5    5    3    3    5    3    1    5   20   17  6.81
## 15    5    1    3    1    1    1    1    2    1    1   11    6  6.27
## 16   NA   NA   NA    3    5   NA    4    2   NA    5   NA   NA  0.36
## 17    5    1    5    4    3    4    1    1    1    1   18    8  6.57
## 18    5   NA    1    3    1   NA    5    5    1   NA   NA   NA  2.30
## 19    5    1    1    1    5    1    5    2    5    3   13   16 -4.68
## 20   NA   NA   NA    1    2   NA    5    5   NA    3   NA   NA  4.24
Challenge 1: Isolate item imputation per questionnaire or subscale.
Use predictor matrix: rows indicate imputed variable, columns are predictors. For each questionnaire, only its own items are used as predictors to impute the item scores.
- Isolate items for Questionnaire 1:
predQ <- make.predictorMatrix(dat)
predQ[1:5,6:10] <- 0
predQ[1:5,]
##      Q1i1 Q1i2 Q1i3 Q1i4 Q1i5 Q2i1 Q2i2 Q2i3 Q2i4 Q2i5 TSQ1 TSQ2 cov1
## Q1i1    0    1    1    1    1    0    0    0    0    0    1    1    1
## Q1i2    1    0    1    1    1    0    0    0    0    0    1    1    1
## Q1i3    1    1    0    1    1    0    0    0    0    0    1    1    1
## Q1i4    1    1    1    0    1    0    0    0    0    0    1    1    1
## Q1i5    1    1    1    1    0    0    0    0    0    0    1    1    1
- Isolate items for Questionnaire 2:
predQ[6:10,1:5] <- 0
predQ[6:10,]
##      Q1i1 Q1i2 Q1i3 Q1i4 Q1i5 Q2i1 Q2i2 Q2i3 Q2i4 Q2i5 TSQ1 TSQ2 cov1
## Q2i1    0    0    0    0    0    0    1    1    1    1    1    1    1
## Q2i2    0    0    0    0    0    1    0    1    1    1    1    1    1
## Q2i3    0    0    0    0    0    1    1    0    1    1    1    1    1
## Q2i4    0    0    0    0    0    1    1    1    0    1    1    1    1
## Q2i5    0    0    0    0    0    1    1    1    1    0    1    1    1
- Total score cannot be used as predictor for its own items.
predQ[1:5,11] <- 0
predQ[6:10,12] <- 0

predQ[1:10,]
##      Q1i1 Q1i2 Q1i3 Q1i4 Q1i5 Q2i1 Q2i2 Q2i3 Q2i4 Q2i5 TSQ1 TSQ2 cov1
## Q1i1    0    1    1    1    1    0    0    0    0    0    0    1    1
## Q1i2    1    0    1    1    1    0    0    0    0    0    0    1    1
## Q1i3    1    1    0    1    1    0    0    0    0    0    0    1    1
## Q1i4    1    1    1    0    1    0    0    0    0    0    0    1    1
## Q1i5    1    1    1    1    0    0    0    0    0    0    0    1    1
## Q2i1    0    0    0    0    0    0    1    1    1    1    1    0    1
## Q2i2    0    0    0    0    0    1    0    1    1    1    1    0    1
## Q2i3    0    0    0    0    0    1    1    0    1    1    1    0    1
## Q2i4    0    0    0    0    0    1    1    1    0    1    1    0    1
## Q2i5    0    0    0    0    0    1    1    1    1    0    1    0    1
- Item scores cannot be used as predictor together with its own total scores.
predQ[11:13,1:10] <- 0
predQ[11:13,]
##      Q1i1 Q1i2 Q1i3 Q1i4 Q1i5 Q2i1 Q2i2 Q2i3 Q2i4 Q2i5 TSQ1 TSQ2 cov1
## TSQ1    0    0    0    0    0    0    0    0    0    0    0    1    1
## TSQ2    0    0    0    0    0    0    0    0    0    0    1    0    1
## cov1    0    0    0    0    0    0    0    0    0    0    1    1    0
- Total score should be used as predictor for other variables when used in the analysis model.
predQ[11:13,11:13]
##      TSQ1 TSQ2 cov1
## TSQ1    0    1    1
## TSQ2    1    0    1
## cov1    1    1    0
- Full predictor matrix:
predQ
##      Q1i1 Q1i2 Q1i3 Q1i4 Q1i5 Q2i1 Q2i2 Q2i3 Q2i4 Q2i5 TSQ1 TSQ2 cov1
## Q1i1    0    1    1    1    1    0    0    0    0    0    0    1    1
## Q1i2    1    0    1    1    1    0    0    0    0    0    0    1    1
## Q1i3    1    1    0    1    1    0    0    0    0    0    0    1    1
## Q1i4    1    1    1    0    1    0    0    0    0    0    0    1    1
## Q1i5    1    1    1    1    0    0    0    0    0    0    0    1    1
## Q2i1    0    0    0    0    0    0    1    1    1    1    1    0    1
## Q2i2    0    0    0    0    0    1    0    1    1    1    1    0    1
## Q2i3    0    0    0    0    0    1    1    0    1    1    1    0    1
## Q2i4    0    0    0    0    0    1    1    1    0    1    1    0    1
## Q2i5    0    0    0    0    0    1    1    1    1    0    1    0    1
## TSQ1    0    0    0    0    0    0    0    0    0    0    0    1    1
## TSQ2    0    0    0    0    0    0    0    0    0    0    1    0    1
## cov1    0    0    0    0    0    0    0    0    0    0    1    1    0
Challenge 2: Passive imputation of the total score
The total score is used as predictor, but not directly imputed. The item scores are imputed and the total scores re-calculated from the imputed item scores: passive imputation.
First, lets explain the passive imputation process. Each item is imputed as specified in the imputation model. For our example this means that the item scores for Q1 are imputed by using the remaining items of Q1, and the total score of Q2 and the covariate. So during each iteration for Q1:
1. Impute item scores using items from its own questionnaire, total score(s) from other questionnaires and covariate(s).
\(Q1i1_i = Q1i2_i \dot\beta_1 + Q1i3_i \dot\beta_2 + Q1i4_i \dot\beta_3 + Q1i5_i \dot\beta_4 + TSQ2_i \dot\beta_5 + cov1_i \dot\beta_6\)\(Q1i2_i = Q1i1_i \dot\beta_1 + Q1i3_i \dot\beta_2 + Q1i4_i \dot\beta_3 + Q1i5_i \dot\beta_4 + TSQ2_i \dot\beta_5 + cov1_i \dot\beta_6\)\(etc.\)
2. Total score is re-calculated using the imputed item scores.
\(TSQ1_i = Q1i1_i + Q1i2_i + Q1i3_i + Q1i4_i + Q1i5_i\)
3. Updated total score is used as predictor for covariate(s) and items of other questionnaires in next iteration.
\(Q2i1_i = Q2i2_i \dot\beta_1 + Q2i3_i \dot\beta_2+ Q2i4_i \dot\beta_3+ Q2i5_i \dot\beta_4+ TSQ1_i \dot\beta_5 + cov1_i \dot\beta_6\)
Note the \(_i\) indicates imputed value from the previous iteration.
- To update the total scores after each iteration, with the imputed item scores, we change the imputation method for the total scores.
imp0 <- mice(dat, pred = predQ, m =1, maxit =0)
methodQ <- imp0$method
methodQ[c("TSQ1", "TSQ2")]
##  TSQ1  TSQ2
## "pmm" "pmm"
- The total score is calculated as the sum of the items.
methodQ["TSQ1"] <- "~I(Q1i1 + Q1i2 + Q1i3 + Q1i4 + Q1i5)"
methodQ["TSQ2"] <- "~I(Q2i1 + Q2i2 + Q2i3 + Q2i4 + Q2i5)"
methodQ[c("TSQ1", "TSQ2")]
##                                   TSQ1                                   TSQ2
## "~I(Q1i1 + Q1i2 + Q1i3 + Q1i4 + Q1i5)" "~I(Q2i1 + Q2i2 + Q2i3 + Q2i4 + Q2i5)"
Multiple imputation
Using the predictor matrix and the updated method, we can impute the data. The predictor matrix makes sure that the model does not get to large for each imputed item or variable. The methods are set such that the total scores are imputed with passive imputation.
imp <- mice(dat, m=5, meth=methodQ,pred=predQ, maxit=10, seed=12354, print=FALSE)
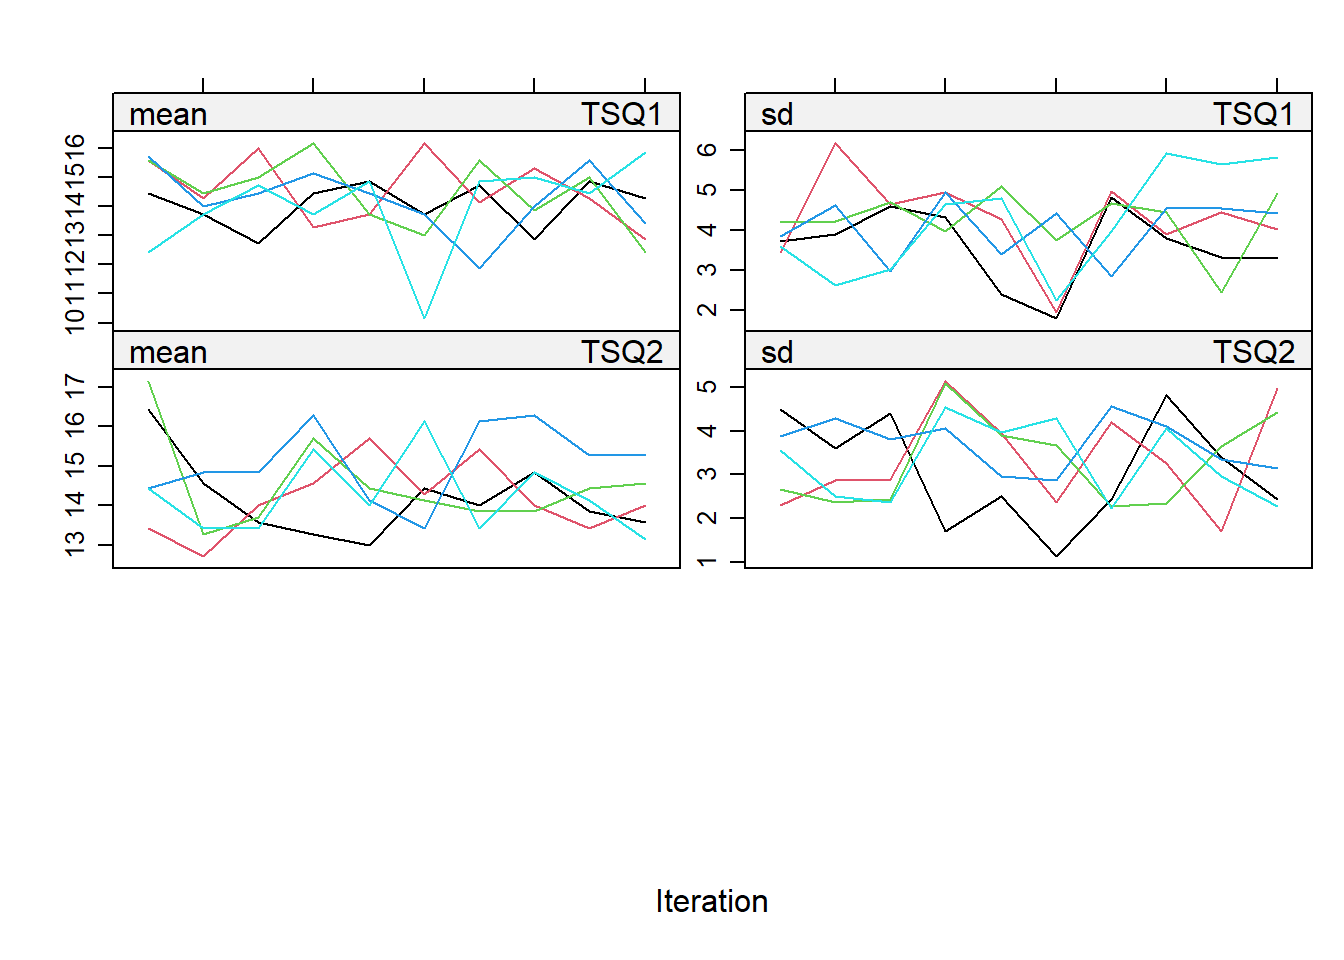
- The convergence of the imputations can be checked by plotting the iterations per imputed dataset.
plot(imp, c("TSQ1", "TSQ2"))
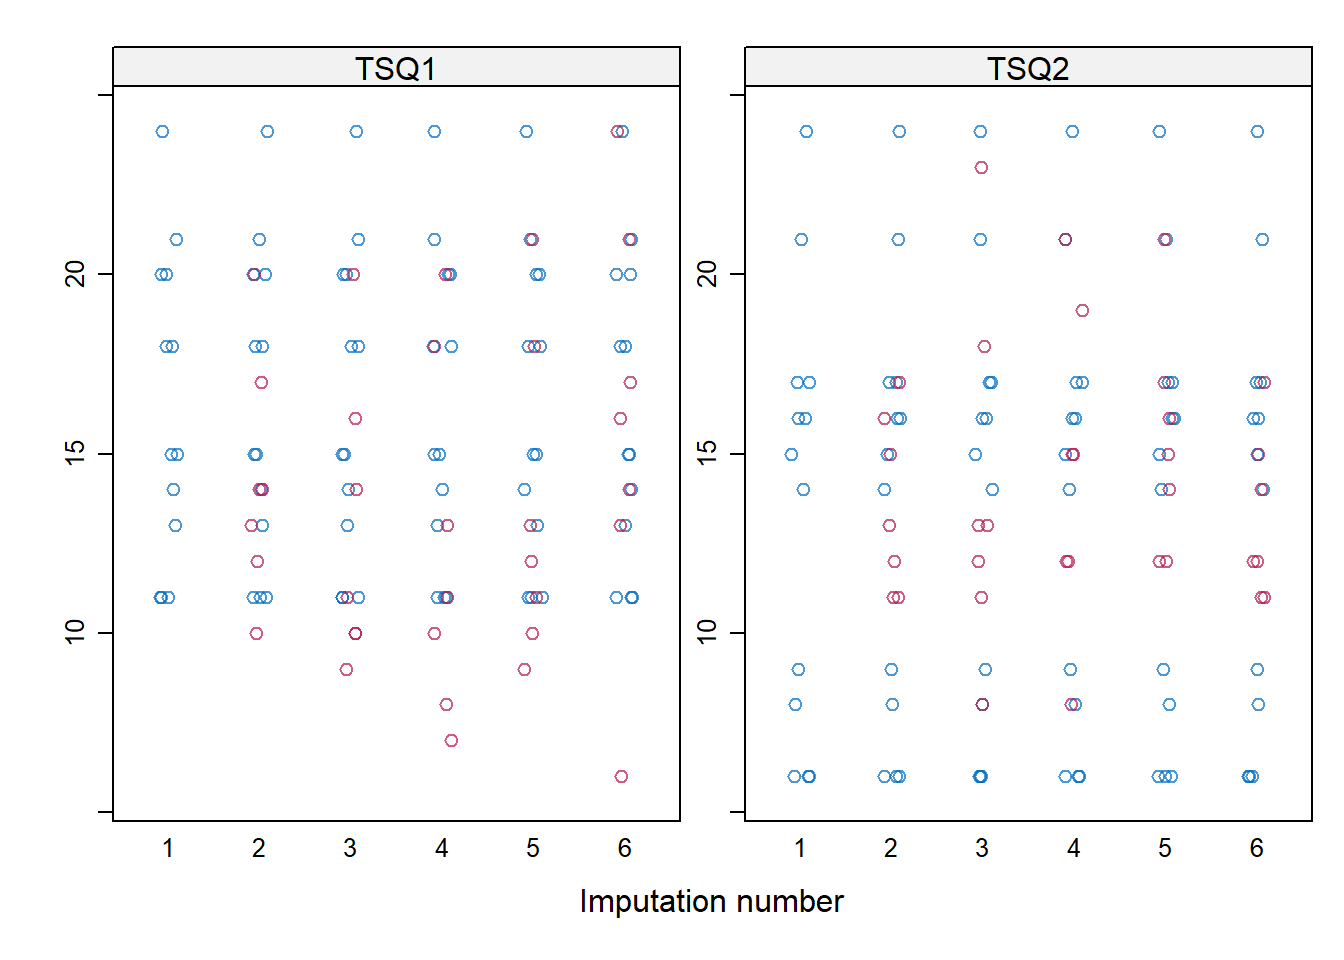
- The imputed values for both total scores can be evaluated in a plot with the imputed values per imputation.
stripplot(imp, TSQ1 + TSQ2 ~ .imp)
Summary
- Item level information may need a different strategy in order to use all available information
- When there are missing values at item level only, use a strategy that involves the item scores.
- When mostly the full questionnaire is missing, the missing data can be dealt with at the total score level.
- Ideally, the item scores are imputed, while using the updated total scores as predictor for other variables in the data, i.e. passive imputation.
Iris Eekhout, PhD
Statistician & Senior Scientist
Iris works on a variety of projects as methodologist and statistical analyst related to child health, e.g. measuring child development (D-score) and adaptive screenings for psycho-social problems (psycat).